CAP-Do
The Cap-Do screen provides users with the ability to review the performance of a KPI and perform a Cap-Do (Check Act Plan Do) if required, where all the abnormality analysis and the corresponding actions can be tracked under one roof.
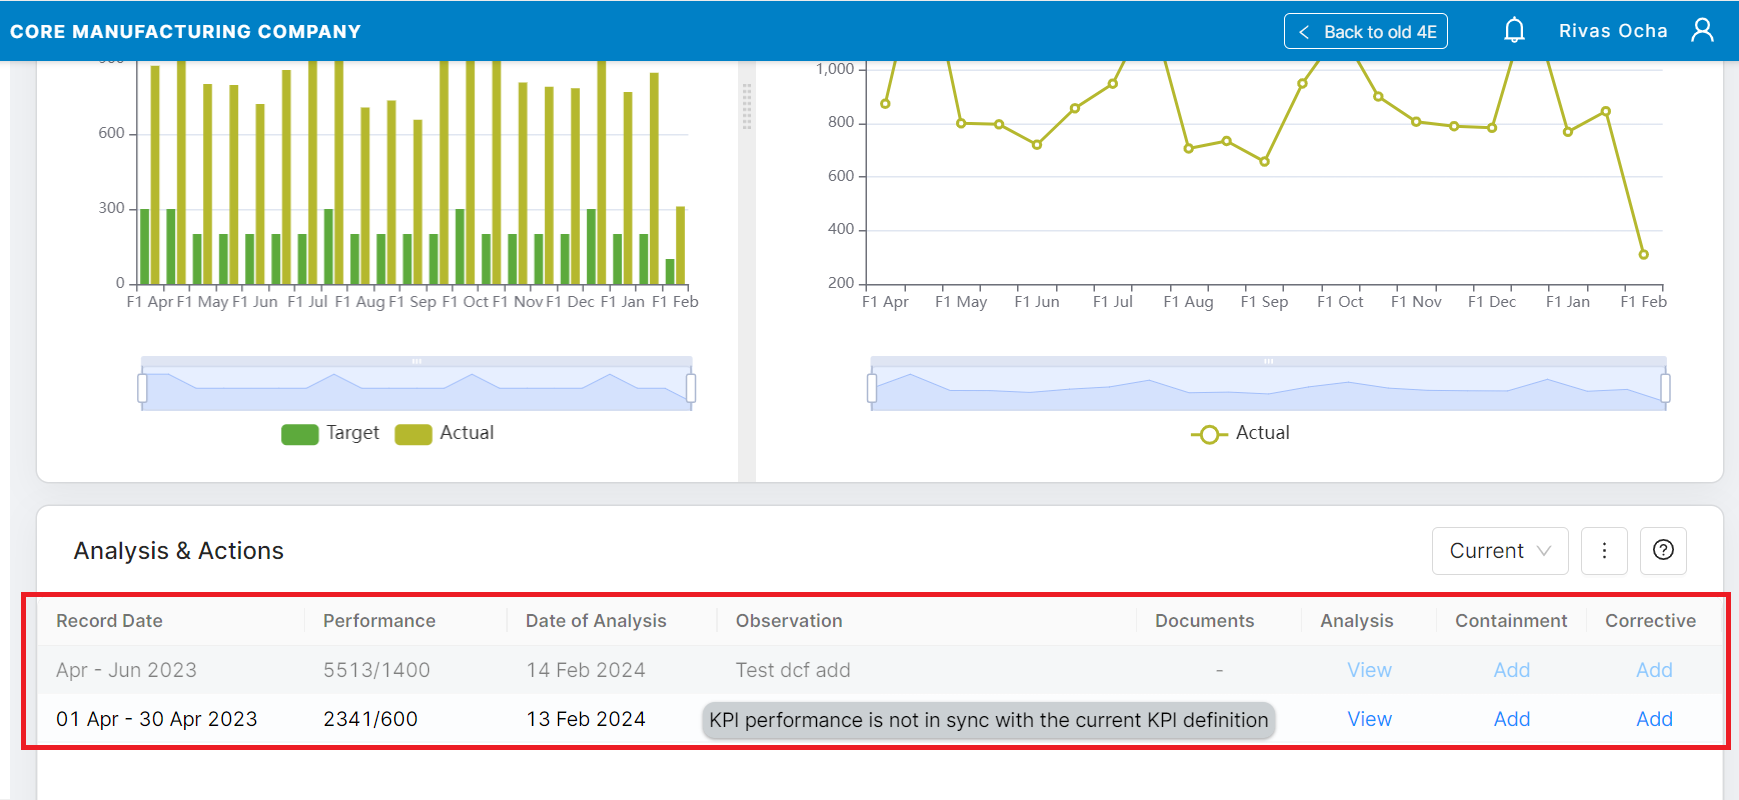
Users can navigate from the Deployment Tree, KPI Scorecard and various custom reports widgets. Below is a sample view of the CAP-Do page.
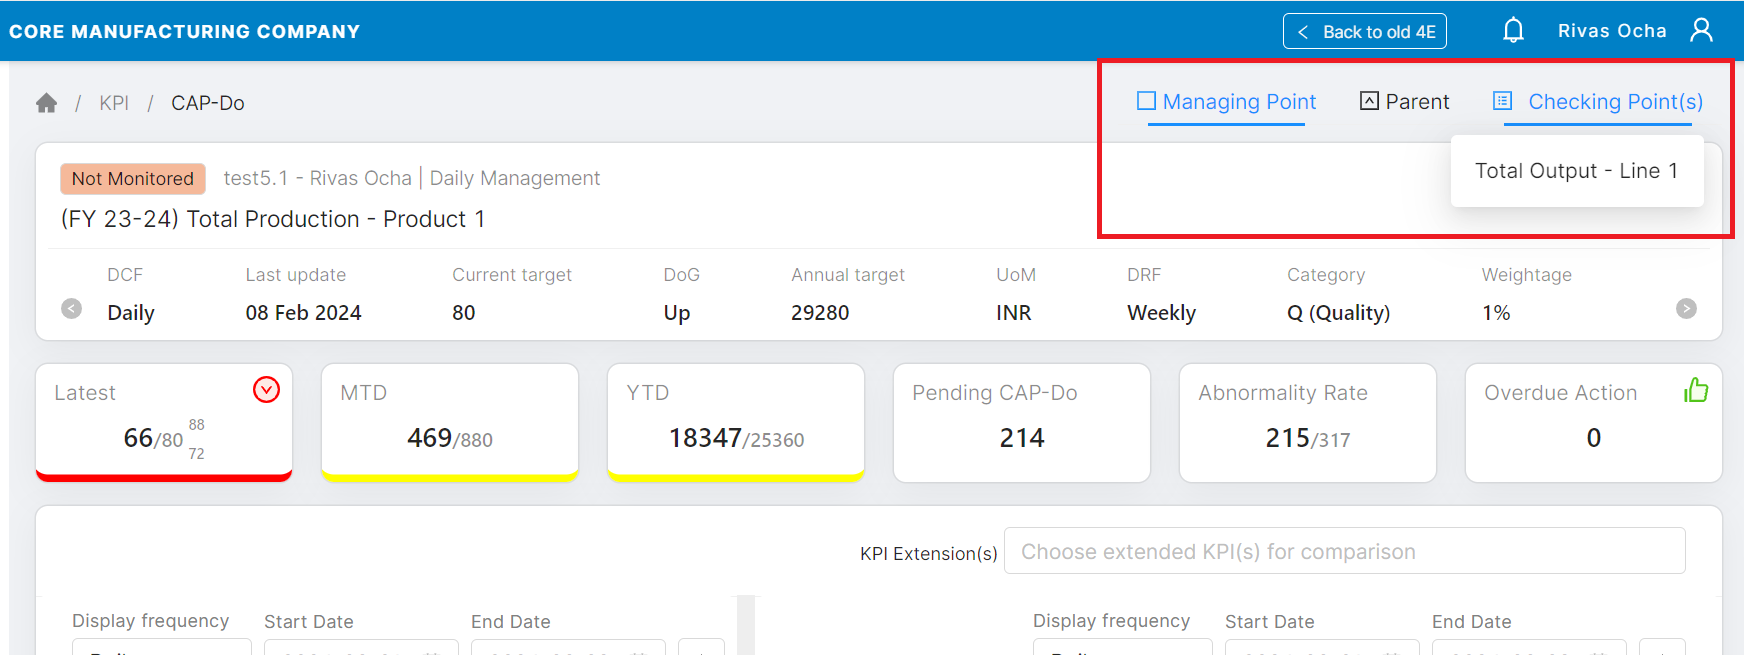
Upon landing on the Cap-Do screen, the user can see the performance of the KPI. Also, users can view the performance of the Parent KPI (if exists) as well as the immediate derived Checking points(s) using the appropriate tabs (Managing Point & Checking Point) on top as highlighted in the above image.
This helps the user to obtain a clear picture of how the MP is being affected and in turn how the parent KPI is affected. If more than one Checking point KPIs is available, select the required KPI from the list as shown in the below image.
KPI Information
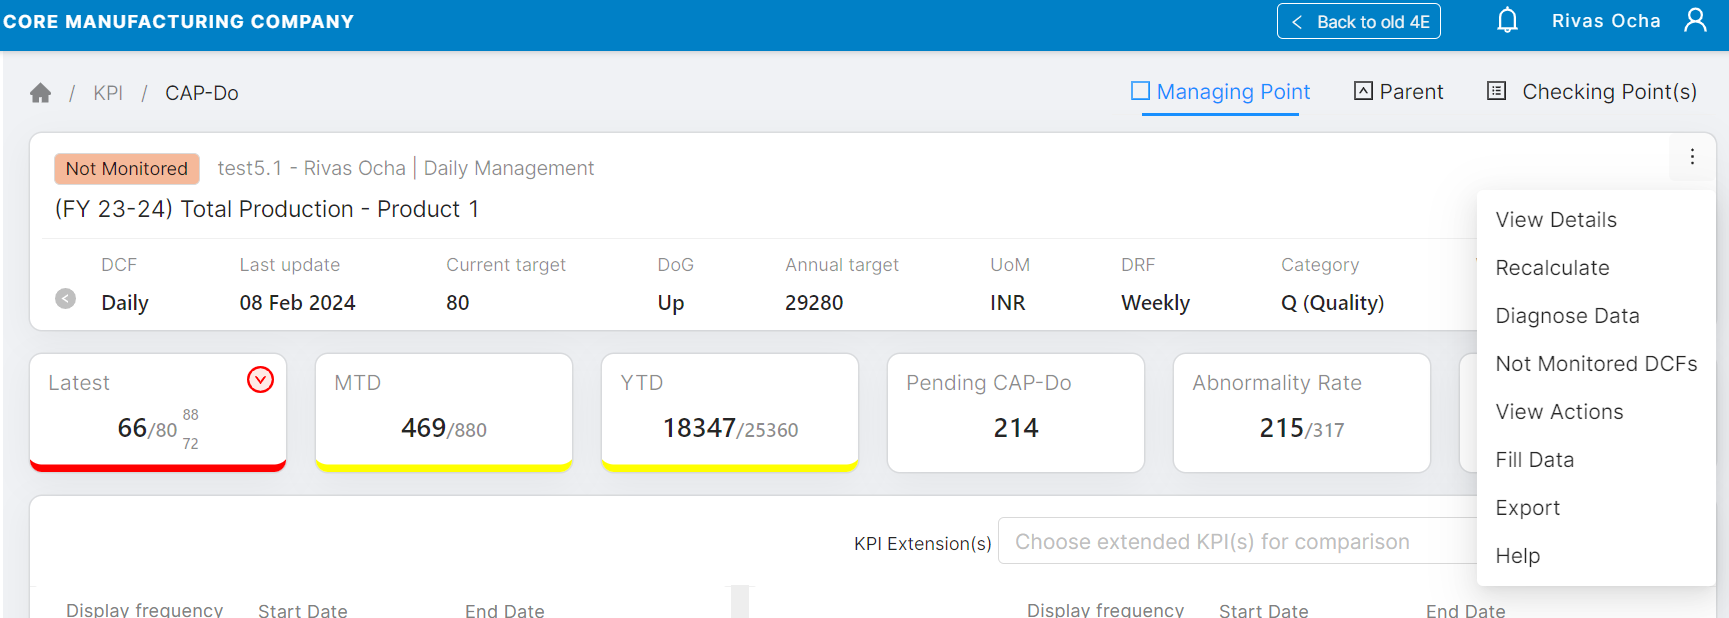
The short menu option on the KPI info strip provides the following options:
View Details: Redirect the users to the KPI Details page.
Recalculate: Users can attempt a recalculation for the KPI actuals. Once recalculation is attempted, users need to refresh the CAP-Do page to view the updated actuals, if any.
Diagnose Date: Diagnose and verify the KPI actuals across the FY
Not Monitored DCFs: View all the not monitored DCFs of the KPI across the selected date range
View Actions: View all the action items recorded for the KPI during analysis and action planning
Fill Data: If the data source of the KPI is an Internal form, then the Fill Data option is enabled for the logged-in user if he has the Fill Form permissions.
Export: 4E also provides the ability to export the KPI data (i.e. actual data) along with brief details of the KPI. Below is a sample file.
Help: Navigate to the knowledge base page for CAP-Do
KPI Performance metrics
The below-mentioned KPI performance metrics tiles are available on the CAP-DO page
Latest: Displays the last performance of the KPI (Actual/Target/LL/UL)
MTD: This tile is visible only for KPIs having DCF < Monthly and contains the MTD performance of the KPI
YTD: Displays the YTD performance of the KPI.
Pending CAP-Do: Displays the count of KPI actuals with negative abnormal performance and 0 Analysis mapped to it. Click on this drawer to view the actuals with Pending Cap-Do
Abnormality Rate: KPI Actuals with negative abnormal performance / Total elapsed KPI Actuals
Overdue Action: Containment/corrective actions with due date > current date
KPI performance graphs
As shown above, the user can view the performance of the KPI in both the Bar chart as well as Line chart.
Depending on the display frequency and date range selected, the graphs show the Target vs Actual plot. Users can set the display frequency to any value which is either equal to or above the data capture frequency of the KPI.
Upon hovering on the bars of the Bar chart or the data points on the Line chart, the numeric Target and Actual values are revealed.
The KPI performance displayed here is a function of multiple attributes of KPI definition like the data source, computed metric(If any), data aggregation method and data aggregation frequency. This page (click here) explains the calculation of KPI actuals on the CAP-Do page.
Please note the default display settings for graphs on the CAP-Do page
Bar Graph - KPI DCF | Default Display Frequency | Start Date | End Date |
|---|---|---|---|
Hourly, ShiftWise, Daily, weekly, fortnightly & Monthly | Monthly | FY start date | FY end date |
Quarterly | Quarterly | FY start date | FY end date |
Half-yearly | Half-yearly | FY start date | FY end date |
Yearly | Yearly | FY start date | FY end date |
Line Graph - KPI DCF | Default Display Frequency | Start Date | End Date |
|---|---|---|---|
Hourly | Hourly | Current Date - 2 days (48 hrs) | Current Date + 0.5 day (12 hrs) |
ShiftWise | ShiftWise | Current Date - 15 days | Current Date + 2 days |
Daily | Daily | Current months start date | Current month end date |
Weekly, Fortnightly, Monthly, Quarterly, Half yearly, Yearly | -same as DCF- | FY start date | FY end date |
![]() As the user selects the display frequency in both bar and line graphs, the selection is saved in the user's browser memory, paired with KPI’s DCF. For e.g. - if the user selects to view an Hourly DCF KPI with Weekly display frequency, and then he opens another Hourly KPI for CAP-Do, the display frequency will automatically be set to Weekly
As the user selects the display frequency in both bar and line graphs, the selection is saved in the user's browser memory, paired with KPI’s DCF. For e.g. - if the user selects to view an Hourly DCF KPI with Weekly display frequency, and then he opens another Hourly KPI for CAP-Do, the display frequency will automatically be set to Weekly
Please note if the display frequency of the KPI is equal to its DCF, then actuals are computed according to the aggregation method in the KPI definition. However, if the selected display frequency > DCF of the KPI then, the actuals are computed according to the YTD calculation method in the KPI definition.
Y-o-Y comparison of KPI performance
Users can also compare the Y-o-Y performance of the extended KPIs. (Read here about Extended KPI). If the KPI being viewed on the CAP-Do page has its extensions, then user can see a dropdown to select the Extended KPIs.
After selecting the required extended KPIs and users can
View the KPI performances over the same timeline
View the rolling trend of KPI performance
Add Analysis
This feature helps the user record an analysis for any abnormalities found during the CAP-Do analysis for the KPI. This feature is available for KPI owner and their superior in the same hierarchy only.
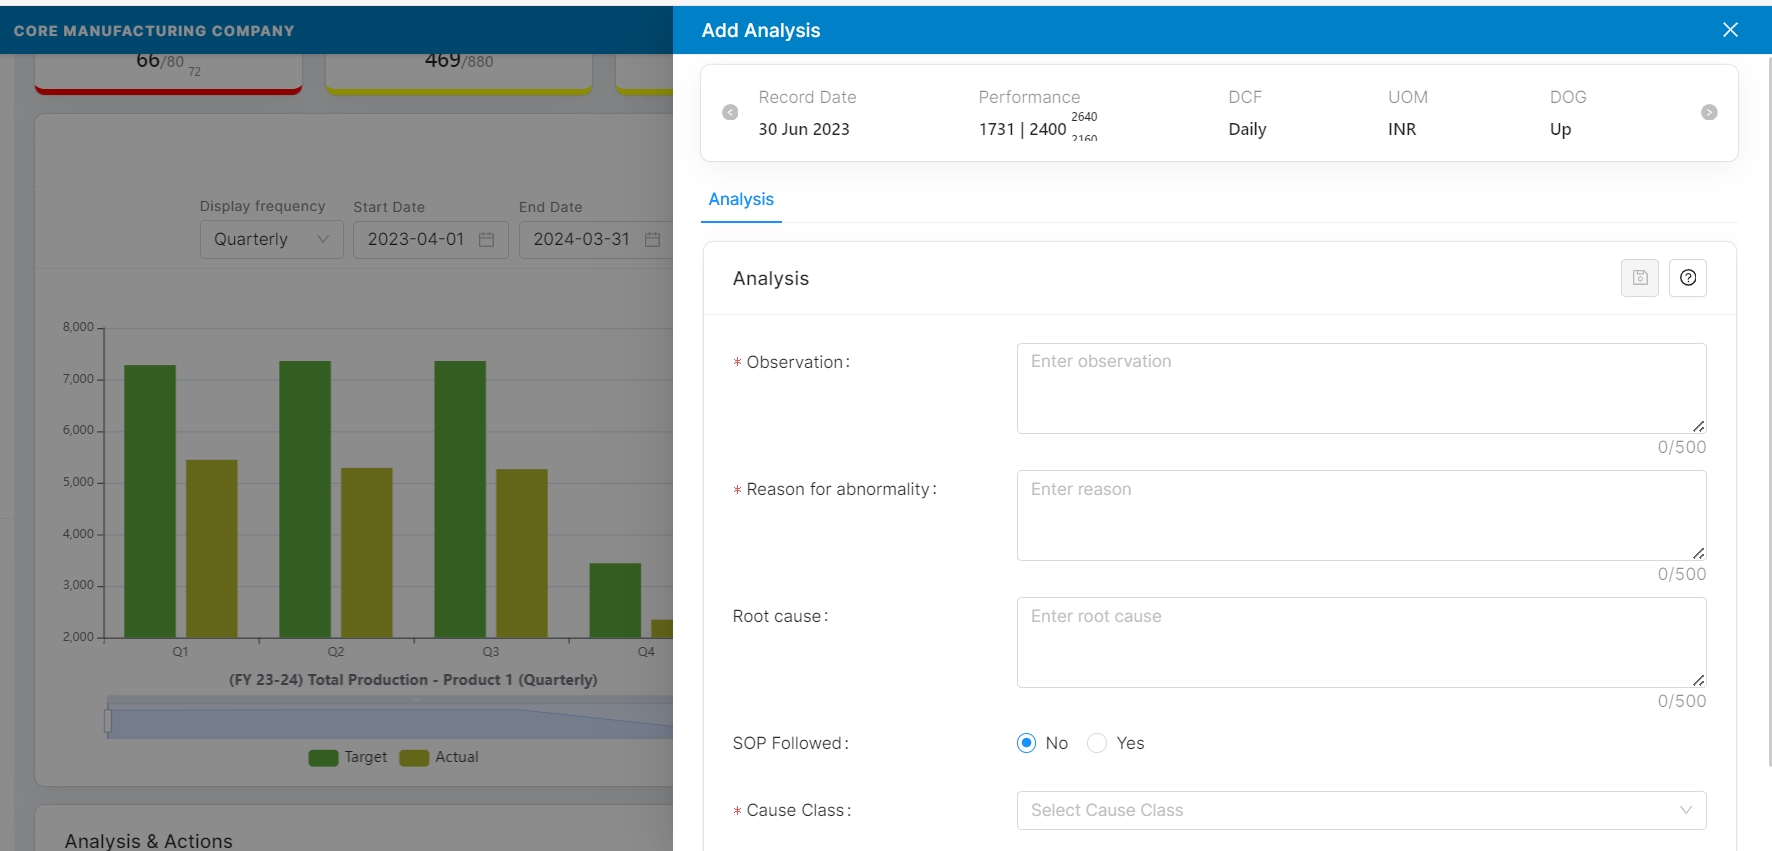
To add an analysis for a KPI performance, hover over the actual on the line graph and click on the “Add Analysis“, it will open a drawer seeking details of the abnormality. Here, the basic information of the KPI and the performance metrics will be pre-fetched and the details around abnormalities have to be entered manually. The abnormality form fields are as follows:
Abnormality / Observation: A short description of the abnormality observed.
Reason for Analysis: Here user can capture the possible reasons for abnormalities and other analysis points
Root Cause: Users can capture the possible root cause for their analysis
SOP Followed: Select 'Yes' if SOP was followed and then select the appropriate cause class. (The cause classes can be configured by the admin. Read more about it here ). Select 'No' if the SOP was not followed and then select the appropriate cause classes. Users can make use of any default reasons provided by 4E to record against this observation when SOP was not followed.
Attachments: The user can upload any supporting documents for this analysis point. (up to 5 MB size)
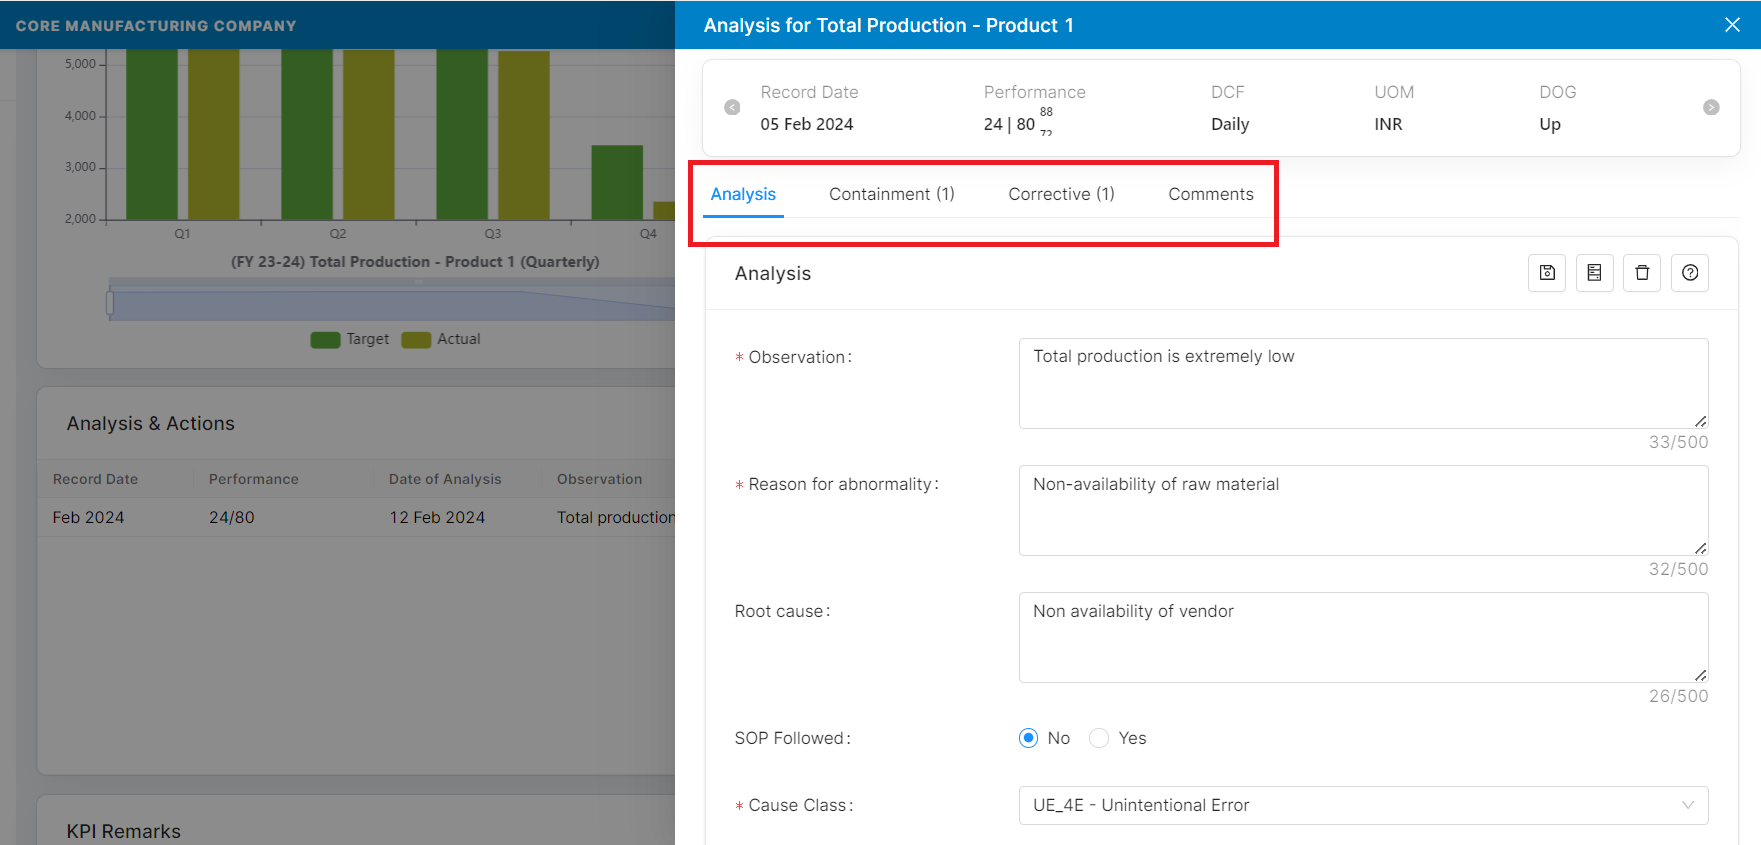
Once the user clicks on Save, the abnormality is recorded and the user can now capture the containment, corrective actions and comments for the abnormality in the same drawer
Please note: Once the analysis is recorded and the user changes the KPI definition, then all the existing Analysis will get greyed out. Users can still work on these analyses or can archive/delete them.
Containment & Corrective Action
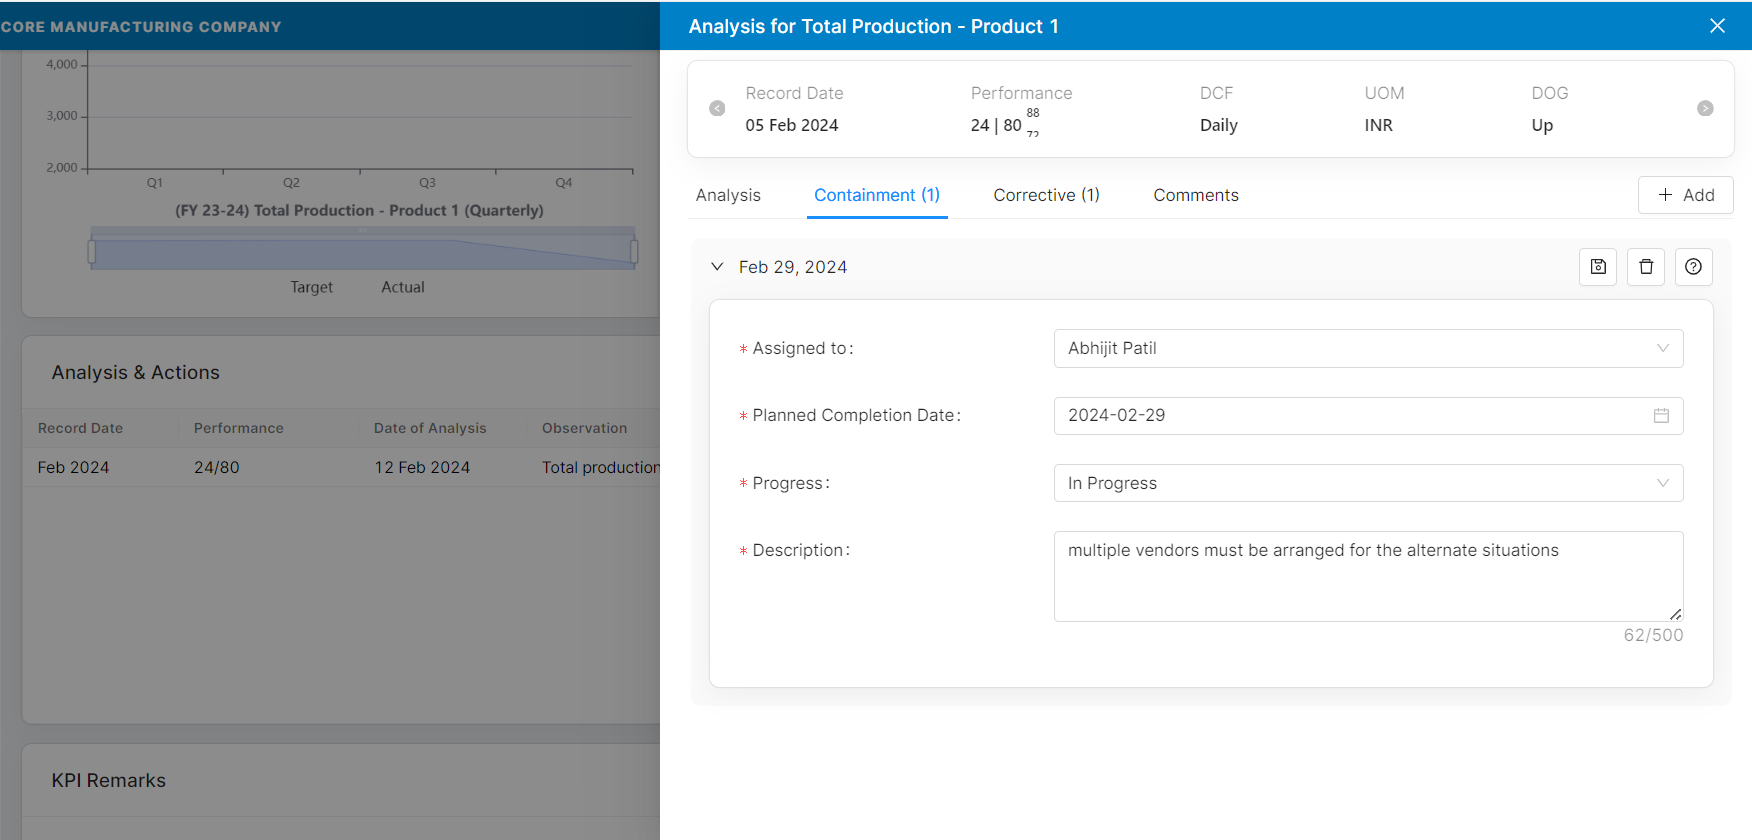
Users can record the Containment and Corrective action for the analysis by capturing the below details
Assigned to: Owner of the containment action taken
Planned date of completion
Progress: Status of the action which includes:
Not Started
In Progress
Completed
On Hold
Rejected
Description: A short description of the containment action taken.
Effective check status: This field is visible only when the action item is completed. Users can set the effective check status to one of these values:
Under observation
Result as expected
Result beyond expectation
Result below expectation
Candidate for standardisation (Only applicable for corrective actions): This field is enabled only when the action item is completed. If the user would like to mark any action item as a candidate for standardization then upon selecting this option it goes to the supervisor for approval.
Comments: The KPI owner, their superiors in the hierarchy, viewer, and action owners can add a comment on the analysis.
The user has the provision to export the analysis and action items at any point in time using the “Export“ option available on the CAP-Do page

KPI Remarks:
Remarks/comments can also be added to the KPI. These remarks need not be related to any abnormal behaviour of the KPI.
Users can also tag their colleagues in the comments.
Apart from abnormalities, users can also add remarks which are not related to any abnormal behaviour of the KPI. This can be any details that need to be recorded.
Deleting Analysis and Actions
The containment and corrective actions can be deleted individually. However, deleting an abnormality will delete all its associated actions.
Please note deleting a legitimate analysis/abnormality is not at all recommended, hence we advise our users to use this feature carefully.
When there is any data sample, which contains analysis/action items tagged to it, is deleted by the user from the form, then the related analysis/action items get archived and are listed under the archived section.
Archive Analysis
Users can also archive existing analysis recorded on the CAP-Do page if required. This action is available to the KPI owner and admin users only.
Once the analysis is archived, it will move from the current section to the archived section
LAST_UPDATED | 15 Feb 2024, Mritunjoy |
|---|